
My Favorite Tool for Troubleshooting AWS Networks? It’s Not What You Think.

If you've ever had to troubleshoot random packet drops or weird black holes somewhere deep in your AWS network — especially when juggling multiple VPCs, VPNs, or DX connections — you know exactly how frustrating it gets. You pore over security groups, route tables, NACLs, even stare at propagated bgp routes from on-prem, and still end up asking:
“Where the hell did my packets go?”
That’s where AWS Transit Gateway Flow Logs come in. If you’re not using them yet, you’re basically flying blind. They’ve saved me countless hours of head-scratching, acting as both a magnifying glass and a map to track exactly where traffic is (or isn’t) flowing — including how they recently helped me troubleshoot an environment before it even became a problem.
Here’s the official docs if you want to deep dive, but let me show you exactly why they’re now one of my absolute go-to tools.
The real story: catching dropped packets and missing routes
This wasn’t even a case of reacting to user tickets. I was just being proactive, poking around our Transit Gateway traffic patterns when my spidey sense went off.
At first glance everything looked fine:
✅ Security groups? Good.
✅ NACLs? Good.
✅ TGW route tables? Propagated. 🤷♂️
But once I fired up Transit Gateway Flow Logs, the picture changed immediately.
Within minutes, it was obvious:
✅ Bytes and packets flowing in and out — showing a normal, healthy baseline.
🚩 Bytes dropped due to no route — the smoking gun right there.
⚠️ Traffic hitting a black hole — confirming packets literally had nowhere to go.
Because I spotted it early, we updated the TGW route tables and prevented what would have eventually turned into a mess of timeouts and latency complaints.
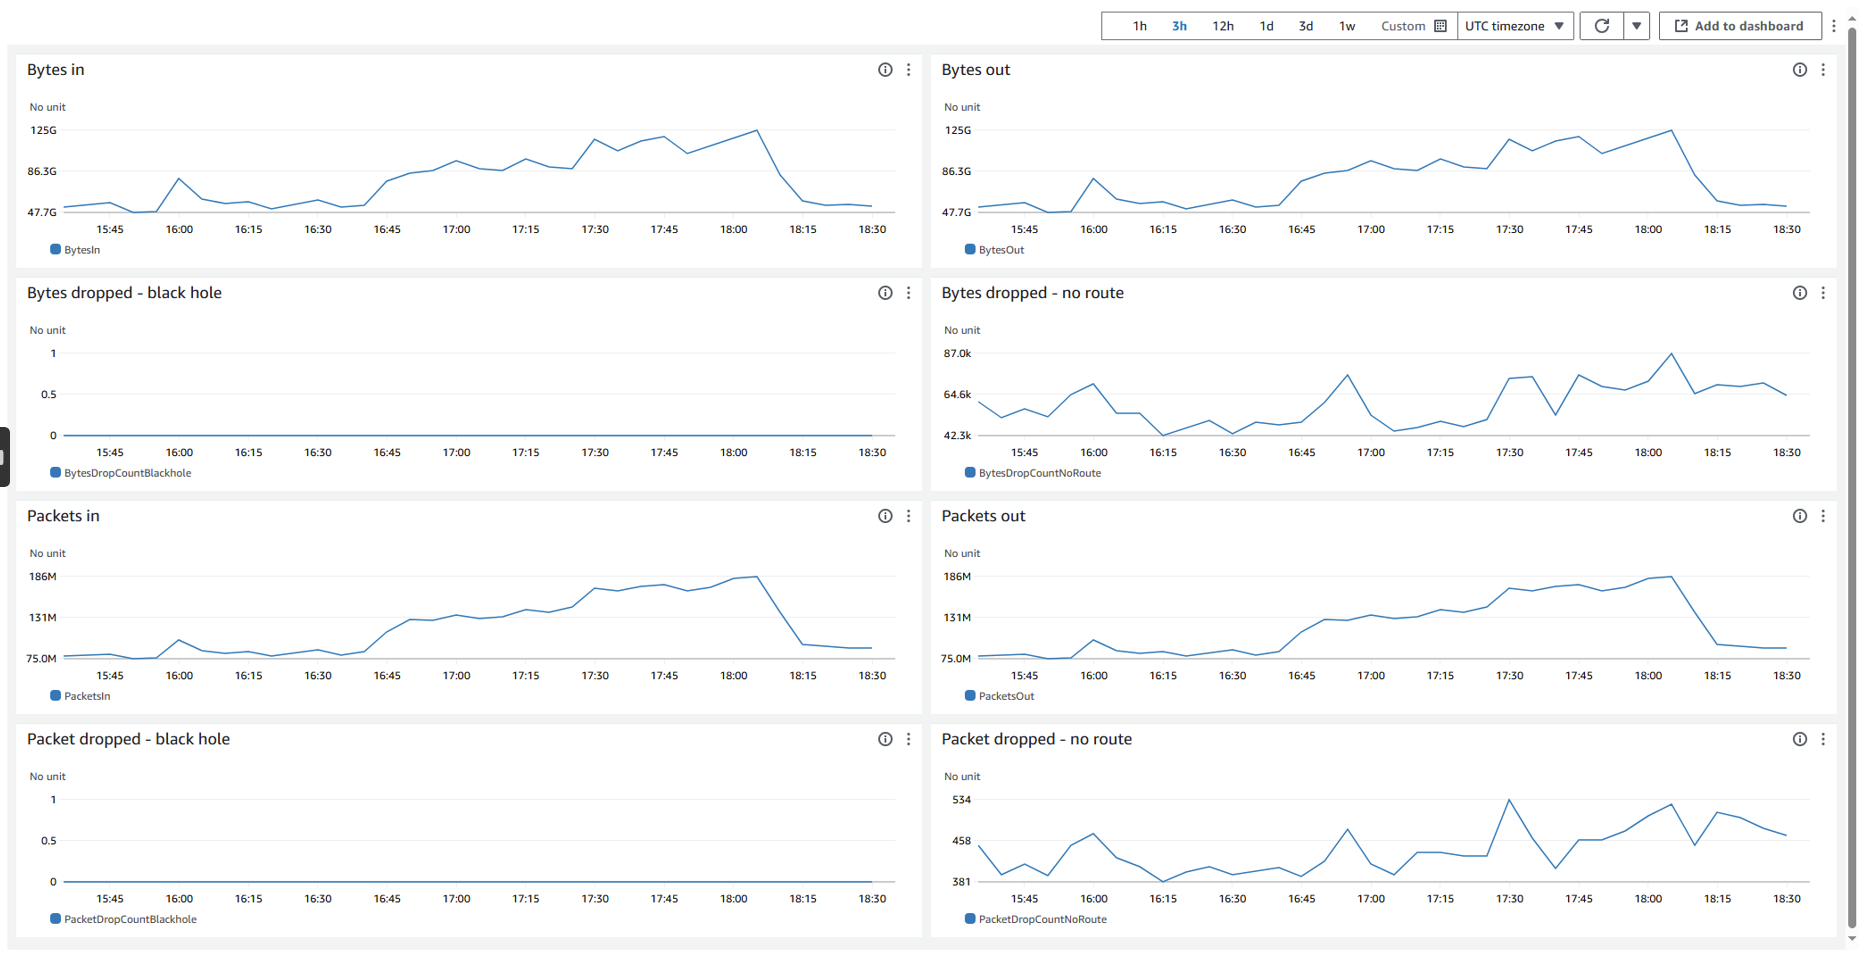
📊 Visual: CloudWatch dashboards show it all
Here’s a look from the CloudWatch dashboards, which instantly told the story:
You can see:
BytesInandPacketsInclimbing steadily — totally normal.Zero
BytesDropCountBlackhole— good news.But a clear pattern on
BytesDropCountNoRoute— telling us exactly where things were silently failing.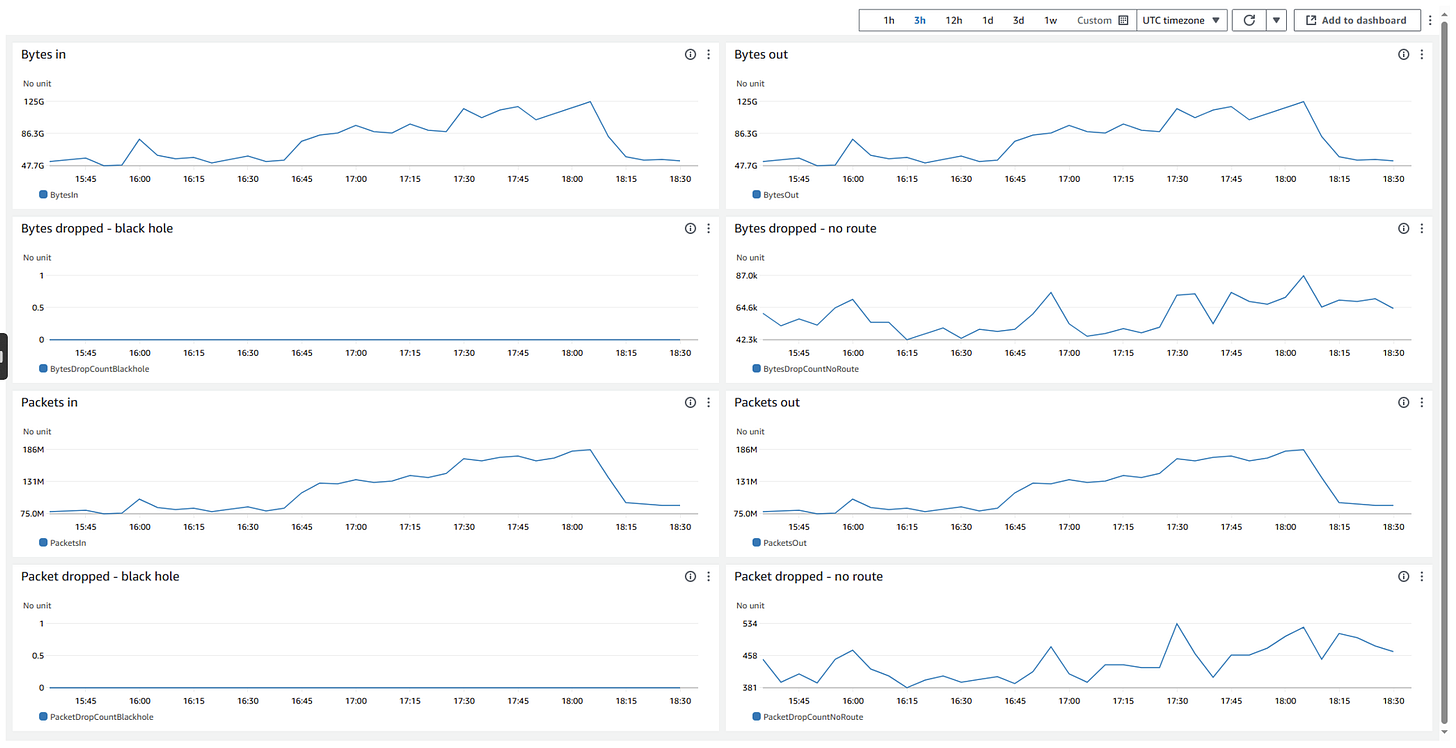
Drilling deeper with Logs Insights
Of course counts alone aren’t enough — I needed to know who was talking to who. So we pulled everything into CloudWatch Logs Insights, filtered for noRoute, and aggregated by srcAddr, dstAddr, protocol, and ports.
Here’s what that looked like in action:
Immediately we could pinpoint:
Which source and destination pairs were failing
How often they were dropping
By what protocol
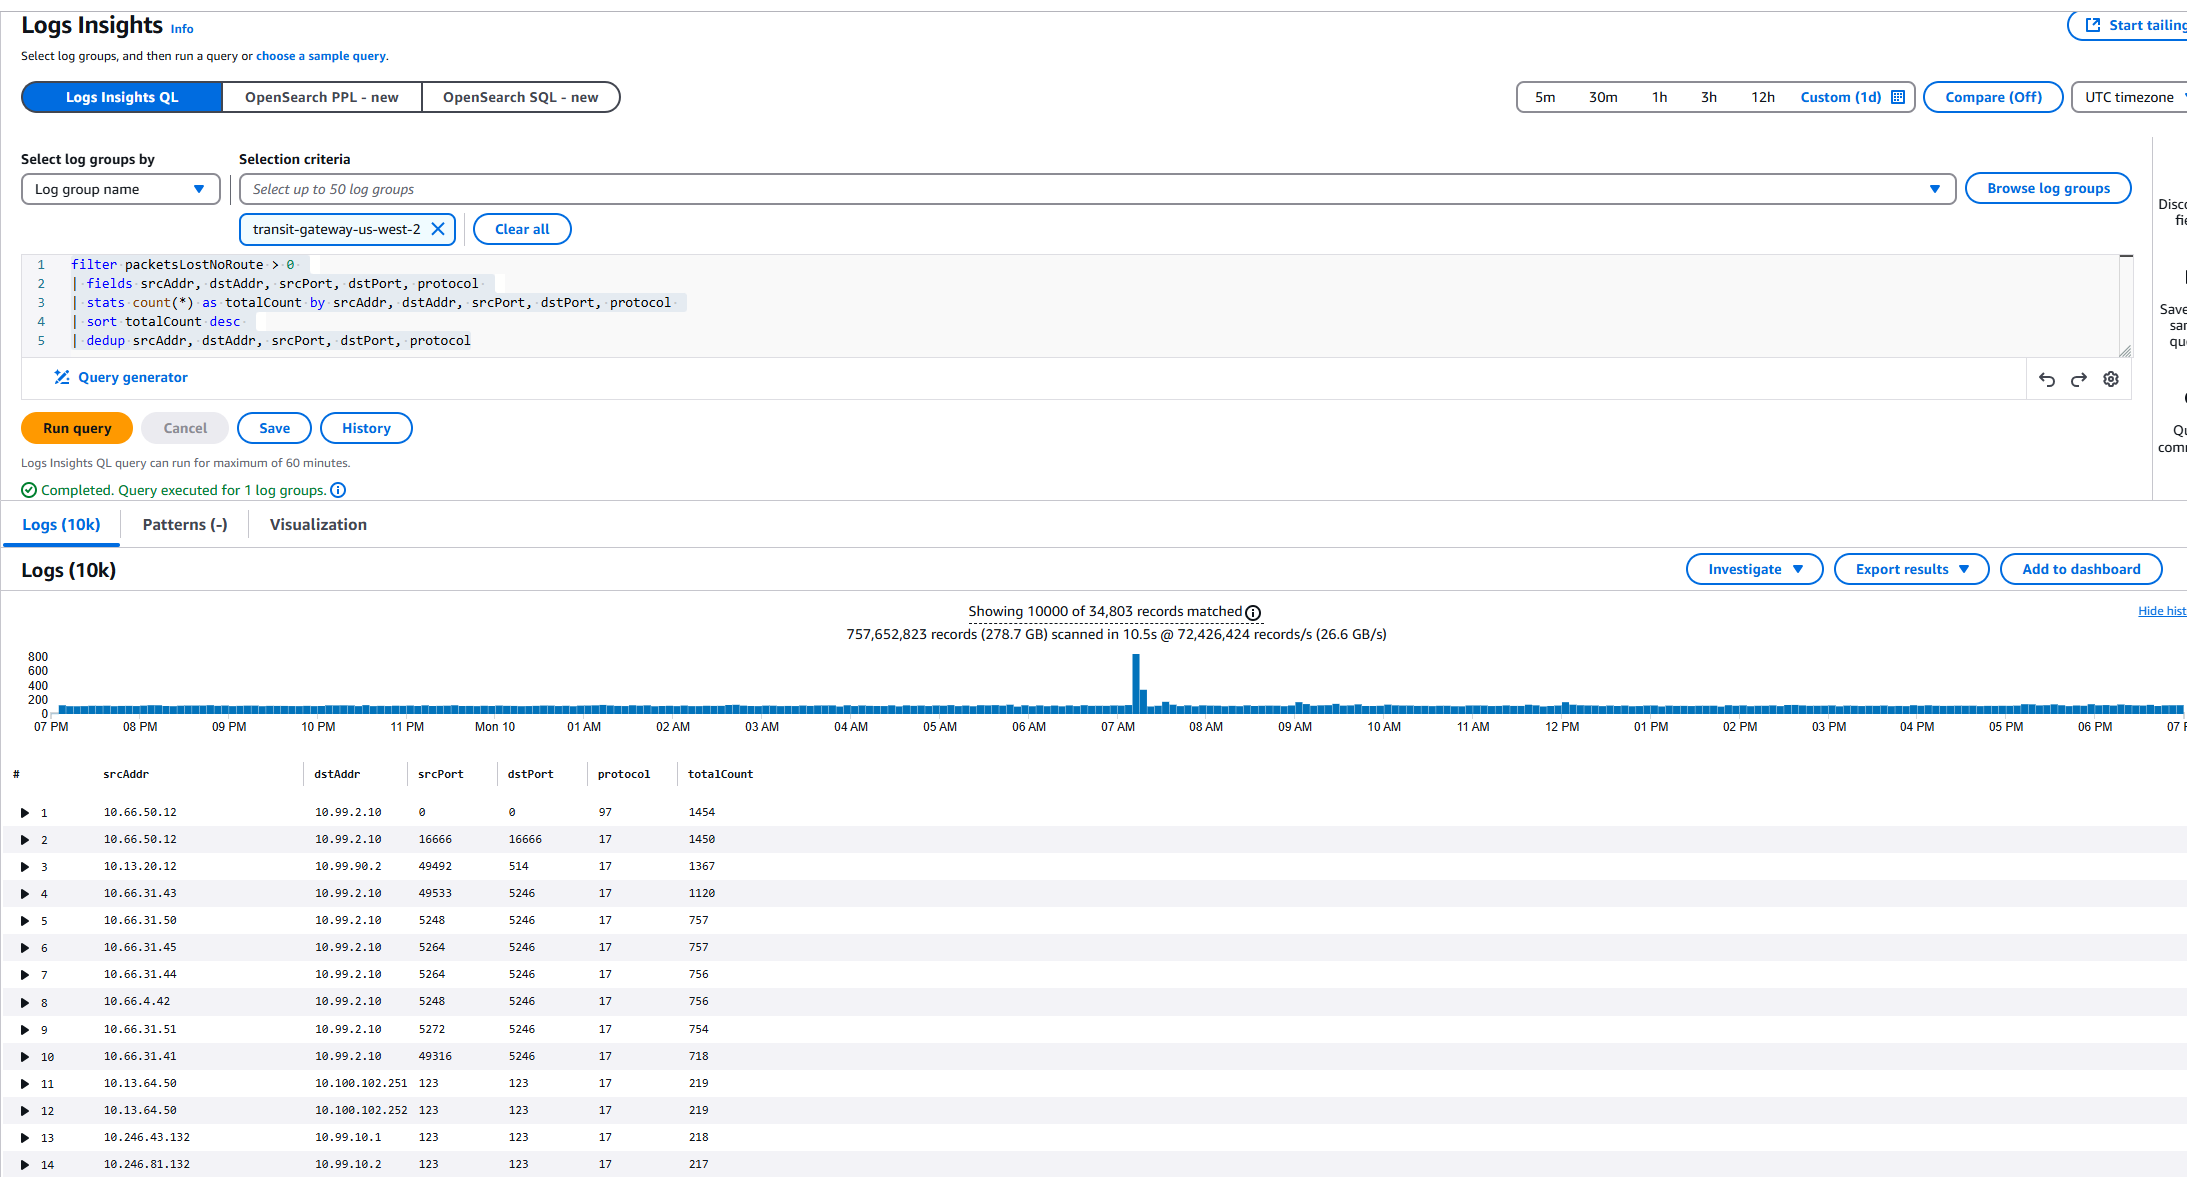
With that level of clarity, updating the missing TGW routes was a 5-minute fix.
Why this is my go-to AWS networking tool
Transit Gateway Flow Logs have easily become my favorite under-the-radar AWS feature. They’re basically your Swiss army knife for networking, because they let you:
🔍 Track down dropped packets — stop guessing between NACLs, SGs, or missing routes.
🗺 Visualize traffic paths — see exactly where bytes go, or don’t.
📊 Baseline and detect anomalies — build dashboards so you spot issues before users do.
🛠 Run post-mortems — pull historical logs to prove exactly when something started breaking.
Final thoughts
At the end of the day, AWS gives us tons of fancy features — but few are as downright practical and sanity-saving as Transit Gateway Flow Logs. If you’re running any kind of multi-VPC or hybrid environment and not using them, you’re basically inviting mystery problems into your life.
If you ever want recommendations on setting these up, building smart Logs Insights queries, or tuning dashboards so your network stays boring (in the best way), just reach out. Always happy to help others with recommendations on cloud cost optimization and keeping things running smooth.